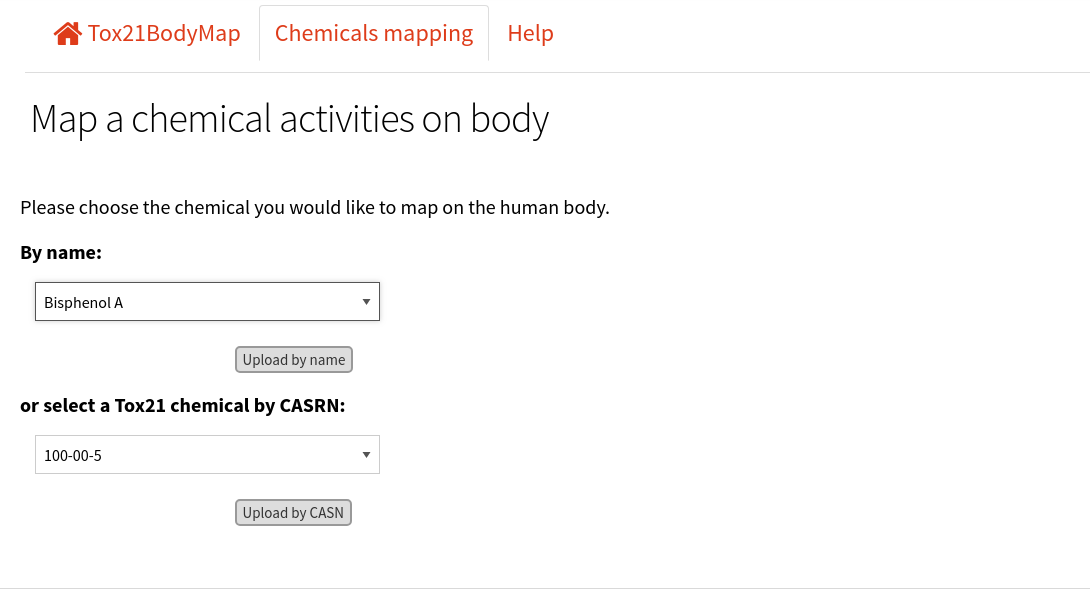
Select a chemical
To start, the user can select a chemical included in the Tox21 chemical library (9,270 chemicals) using chemical name or CASRN via the drop down selection windows.
Chemical information
Chemical information is linked to the EPA chemical dashboard
where the user can access a full chemical description and additional detailed data.
In addition user can link the selected chemical to chemmaps.com
and Tox21 enricher, two National Toxicology Program (NTP) tools allowing user to explore the chemical structural space and further analyze assay results.
Chemical quality control (QC) information from Tox21 efforts is obtained from different sources for assays run through the ToxCast program and NCATS. Tox21BodyMap extracts that information from the NTP-ICE webserver.

Chemical structure is represented using the JS library SmilesDrawer.
Bodymap
Using an approach that combines expert knowledge with tissue-specific gene expression levels to map assay targets to organ systems, the user can visualize where in the human body a selected chemical is more likely to produce effects. Two different mapping are considered:
- using assay gene target
- using assay tissue (where specific gene targets were not available).
The preliminary assay tissue mapping is available for download. The type of mapping is represented in green for the assays gene target mapping and in blue for the assay tissue mapping, where the assay cell type dictated the target organ mapping in lieu of a specific gene target.
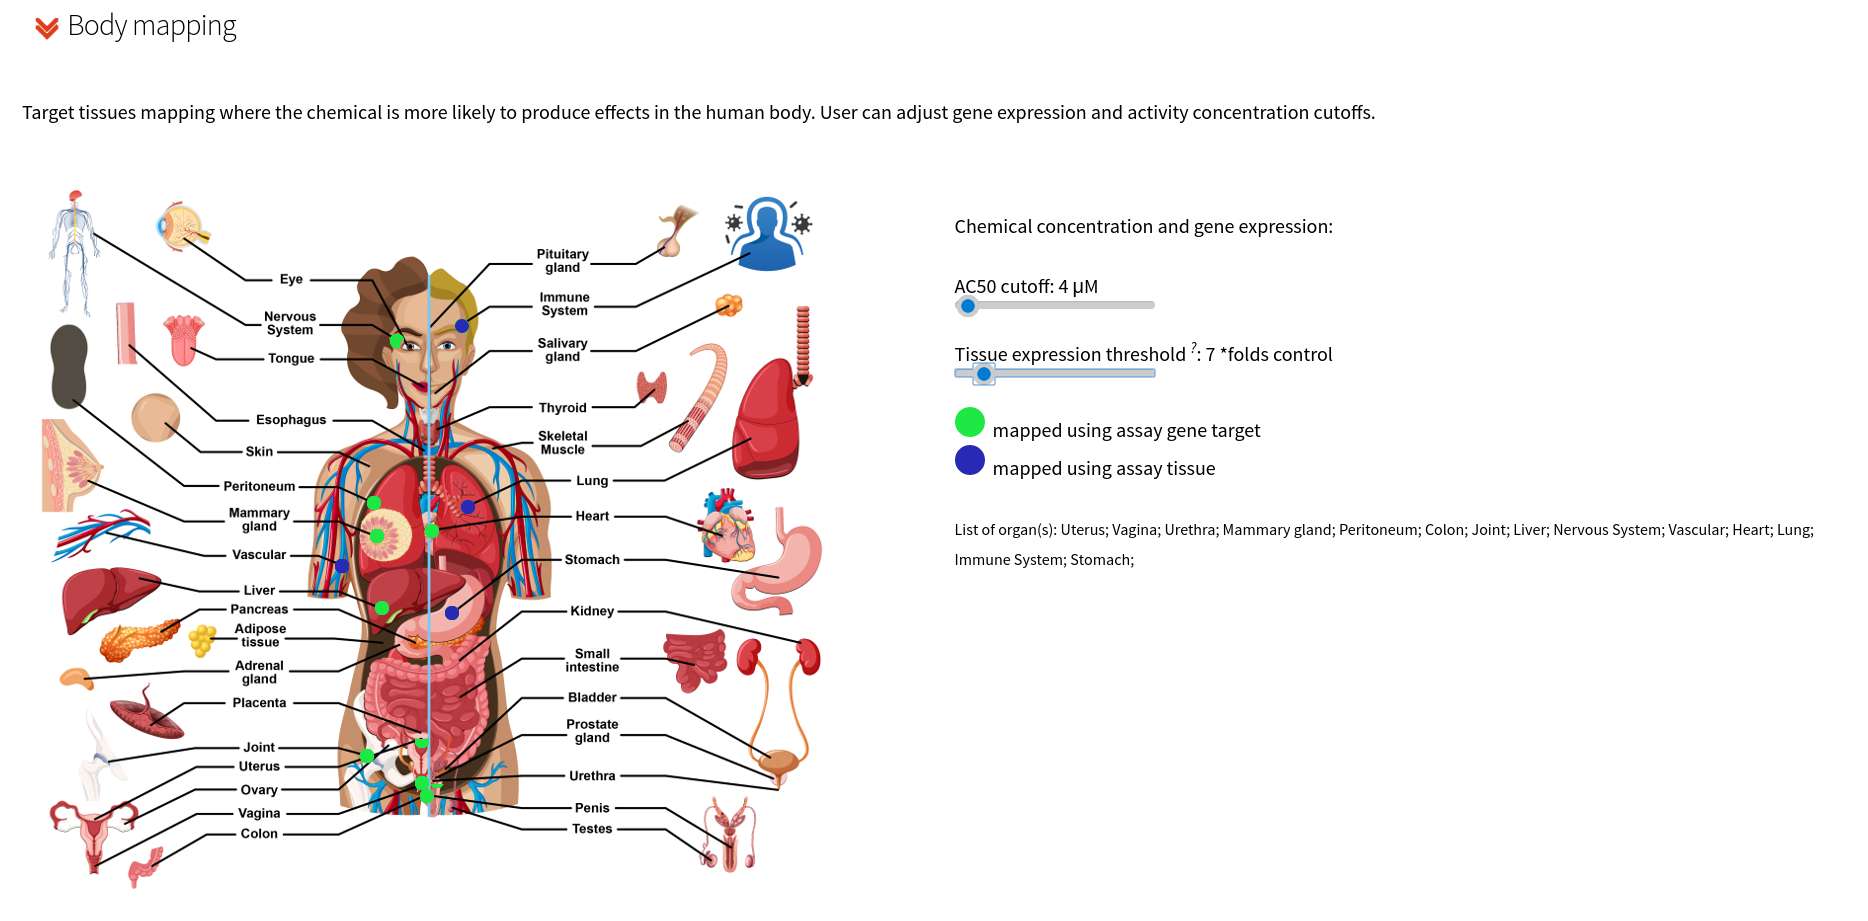
Chemical activity by assays for the Tox21 chemical library have been extracted from the EPA ToxCast data, invitroDBv3.2. The AC50 is the activity concentration at half-maximal activity, and the cutoff represents an upper limit on the chemical activity that will be displayed on the BodyMap.
Assays mapping
Chemical assay activities are represented by grouping into target organ systems of the human body e.g.: cardiovascular system, nervous system, endocrine system, etc. For each system and target organ the chemical -log10 AC50 (µM) by assay is reported. Colored dots represent active assays. This part includes also a browsable, downloadable table with all mapped data used i.e.: gene expression, assays mapped, target organ systems, and AC50 values.
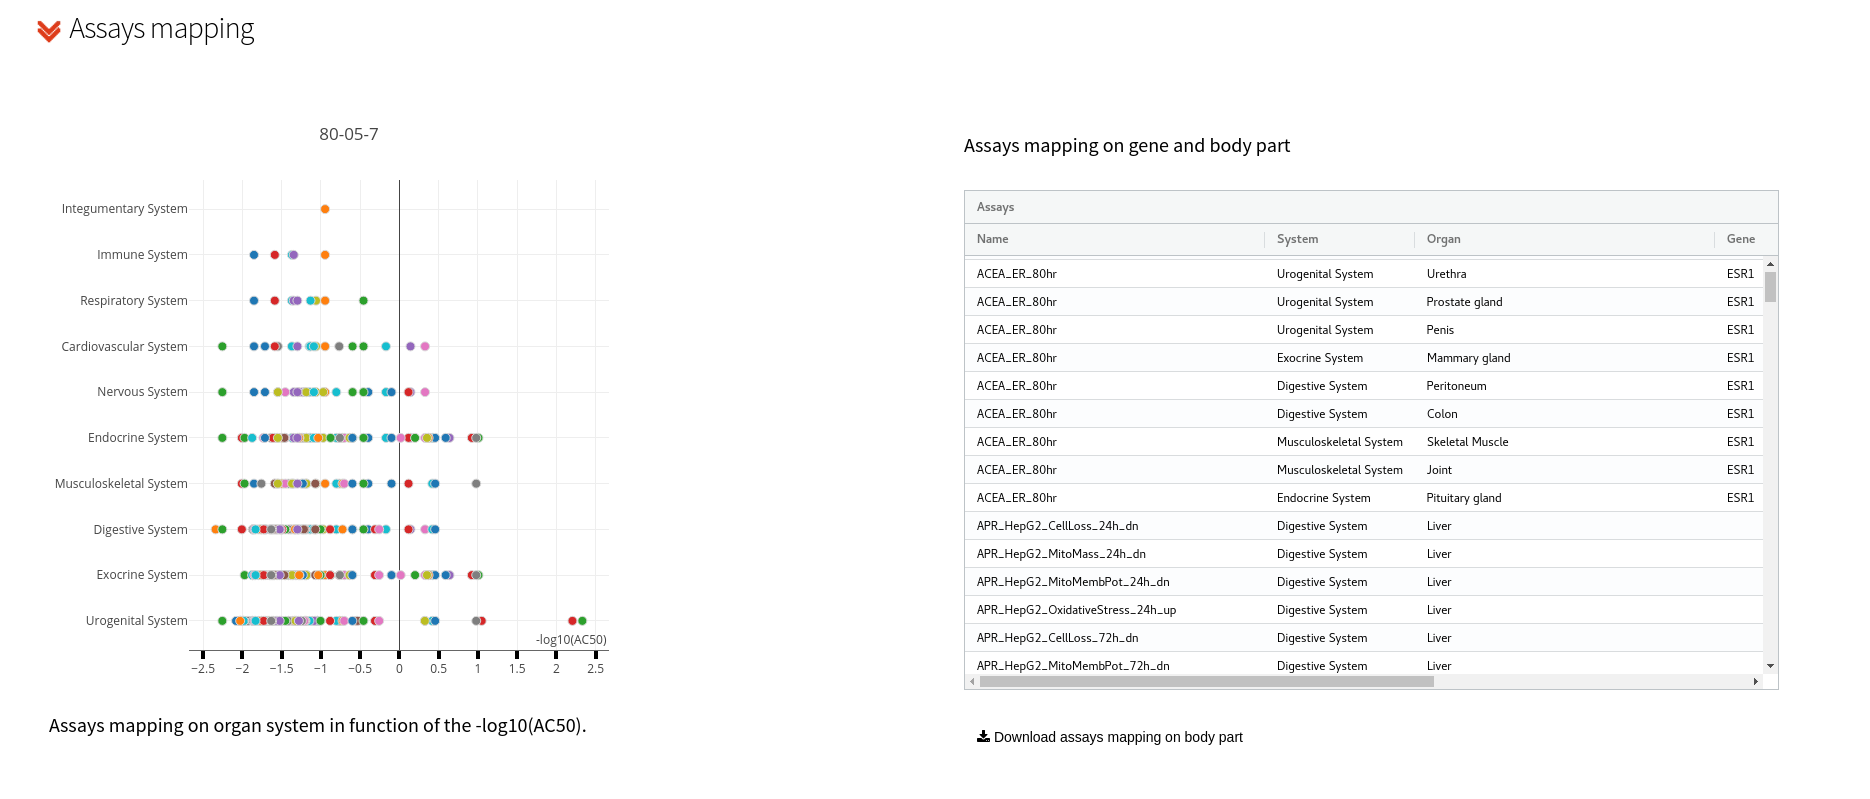
Graphs and tables are represented using the JS libraries plotly and ag-grid.
Network representation
A dynamic, data-driven network representation is used to convey network gene expression, chemical activity and body mapping. The chemical is represented as a red node, assays in pink, genes in green, organs in blue, and human body system in orange nodes. Gene expression and AC50 (µM) are reported on the edges.
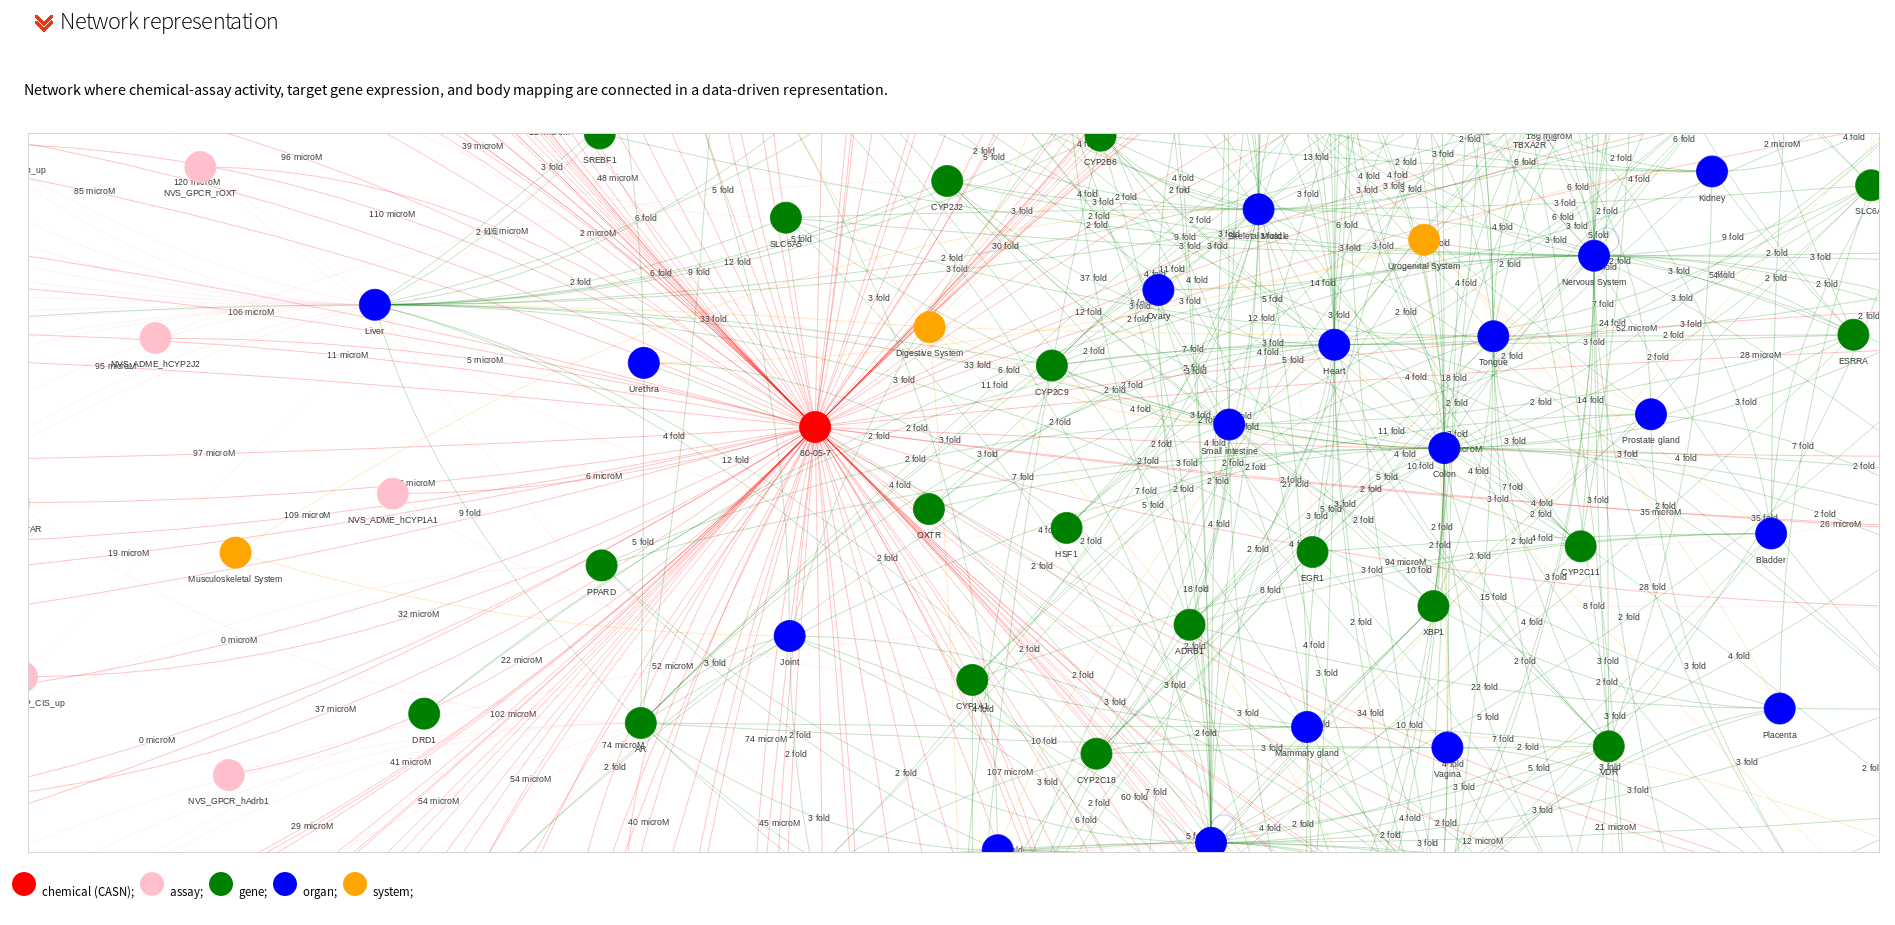
Networks are represented using the library vis.js.